Peto's Paradox and the Future of AI Agents
23 January 2026
3rd Feb update: New METR data released. I reran all plots, including Claude Opus. No real changes to findings—both logistic and Weibull fits are pretty similar. One interesting finding is that the lambda (λ) of GPT-5 and Opus now seems to be similar to humans, but the kappa is still lower in humans, suggesting that humans are able to error-correct better if we think these models are the best fit.
Introduction
Richard Peto observed an interesting paradox. He noted that cancer incidence does not scale linearly with body size or lifespan. A blue whale has a thousand times more cells than a human and lives significantly longer, yet it does not succumb to cancer at a thousand times the rate. If it did, it would die before reaching maturity.
The (probable) solution to the paradox is that large, long-lived mammals have evolved superior error-correction mechanisms. Effectively, they have suppressed their cellular hazard rate to survive the “long task” of a multi-century life (this is very much an ongoing debate, I simplify).
I believe the future of AI agents may be analogous to this paradox, or at least we can learn something from it. As we scale model size (body mass) and demand longer, autonomous task completions (lifespan), we must determine if the hazard rate of model failure remains constant or decreases. Unless larger models exhibit “Peto-like” suppression of error rates-where they become intrinsically “tougher” the longer they operate-simple scaling laws may be insufficient to achieve reliable autonomy.
The current state of evaluation
The current standard for measuring agentic capability comes from METR. Their team has developed a comprehensive suite of software engineering and reasoning tasks, each with an estimated human completion time. They run models against these tasks and fit the results to a logistic regression curve.One major issue is that “task difficulty” and “human time” are basically the same thing in the available data. These are strongly correlated. So when we say, “50% success at time point X,” we are essentially also making a statement about 50% success at difficult tasks. This is obviously a bit of a challenge, as some tasks are very long but not difficult, and difficulty might be quite different for a human and a model. So I use the term “task time/difficulty” throughout the blog, as we can’t really know exactly what this means.
This approach implicitly assumes that task difficulty scales symmetrically. The model produces a smooth “S-curve” of probability, suggesting that moving from 10% to 50% success is roughly as difficult as moving from 50% to 90%. METR uses these fits to report headline figures, such as the time horizon at which a model achieves a 50% pass rate ($T_{50}$).Logistic regression is a totally reasonable modelling assumption here. It fits the data pretty well, and it’s been widely used in the field. I’m not criticising METR here for this choice; it’s just that it has a number of implicit assumptions that perhaps don’t hold.
In many tasks, however, we are basically interested in tail risks. We need to know if a system will fail once in a hundred hours, or once in a thousand. In certain decision-critical systems we need ‘5 9s’ of uptime. The logistic regression approach from METR allows us to calculate the time required for say, 99.99% probability, but because logistic regression is S-shaped, these figures are really squashed at the extreme.
The problem with the logistic fit is that it rigidly couples the model’s limit to its average performance. By fitting the curve to the median (e.g. where the model succeeds 50% of the time) the mathematics effectively force the error rate at the easy end of the curve to vanish exponentially. This creates an illusion of perfection for shorter tasks. It predicts that failure is statistically impossible whereas in reality even the best systems retain a baseline noise floor of random error.
The constant hazard hypothesis
This feels… mechanistically implausible. It is highly likely that achieving success at tasks lasting 2 days is qualitatively different to tasks lasting 2hrs. First, there is the problem of the strong correlation of task difficulty and length, but secondly, in many other fields, we know that going from 99.9 -> 99.99% is a huge jump. It is worth thinking about alternative model views.
Toby Ord recently re-analysed the METR data and proposed a different interpretation. He noted that a logistic fit is essentially a psychometric tool-it measures difficulty-but it may not capture the dynamics of an agent acting over time. He instead fitted a “constant hazard” model, akin to radioactive decay.
In Ord’s view, the probability of success decays exponentially with task length. This is a profound shift in perspective. It implies that “long” tasks are disproportionately more difficult than “short” ones. Achieving 99% reliability is not just a linear step up from 90%; it requires orders of magnitude more robustness. However, Ord’s model assumes the hazard rate is flat-that an agent is just as likely to crash in minute 60 as it was in minute 1. This produces very different estimates at extremes of time / task difficulty for robustness, and proposes a more pessimistic view.
Hazards are never constant
This also feels slightly implausible. In many other fields, hazards are not at all proportional. If we go back to Peto’s paradox: we know that between species, hazards are not proportional, and we also know from life, that people are much more likely to die in infancy, then if they survive, they have a long period of very low hazard until they get old.This has been shown in a neat paper recently by Judith Glynn and Paul Moss reviewing a bunch of historic data across a wide range of infections: nearly all infection appears to have a J-shaped curve with mortality.
This is in fact very easy to model. We can model with the Weibull distribution, which allows the risk to change over time. This introduces a shape parameter, $\kappa$, alongside lambda ($\lambda$), the scale parameter. Lambda represents the average hazard or basic error rate. However, $\kappa$ modifies the error rate over time.
• If $\kappa > 1$, you have a “wearing out” process (like a car part).
• If $\kappa < 1$, you have a decreasing hazard sometimes called the “Lindy Effect” or “infant mortality”. This represents a system where survival implies robustness: if you haven’t failed yet, you probably won’t.Of course you can even model more complex things, with hazard being related to some function of time, if wanted.
This feels, to me, like a more reasonable mechanistic vision for how agentic tasks might work, so I re-ran the METR dataset using these survival models to see if our frontier models are showing any signs of this “Peto-like” robustness.
Methods and results
I fitted two parametric survival models-logistic and Weibull-to the task data for frontier models released. I used Bayesian Information Criterion (BIC) to compare the fits and validated the findings using a hierarchical Bayesian model to estimate the posterior distributions of the parameters. All the code is here. There are a bunch of secondary analyses.
There are three major findings.
The first interesting finding is that for all tested models (and humans), $\kappa$ was below 1, suggesting that over time, hazards reduce. That is – we see a Lindy type effect. Models don’t accumulate errors and get worse; in fact they get better over time. This is really reassuring from a long term agentic model picture, and suggests that success is being driven by overcoming issues over time.
Figure 1: This figure shows the calculated $\kappa$ for each model, with methodology in the GitHub repo. All are below 1, suggesting that over time, the hazard decreases. CI’s are via bootstrapping individual samples (task level bootstrapping was similar). The GPT-2 results are probably not interpretable.
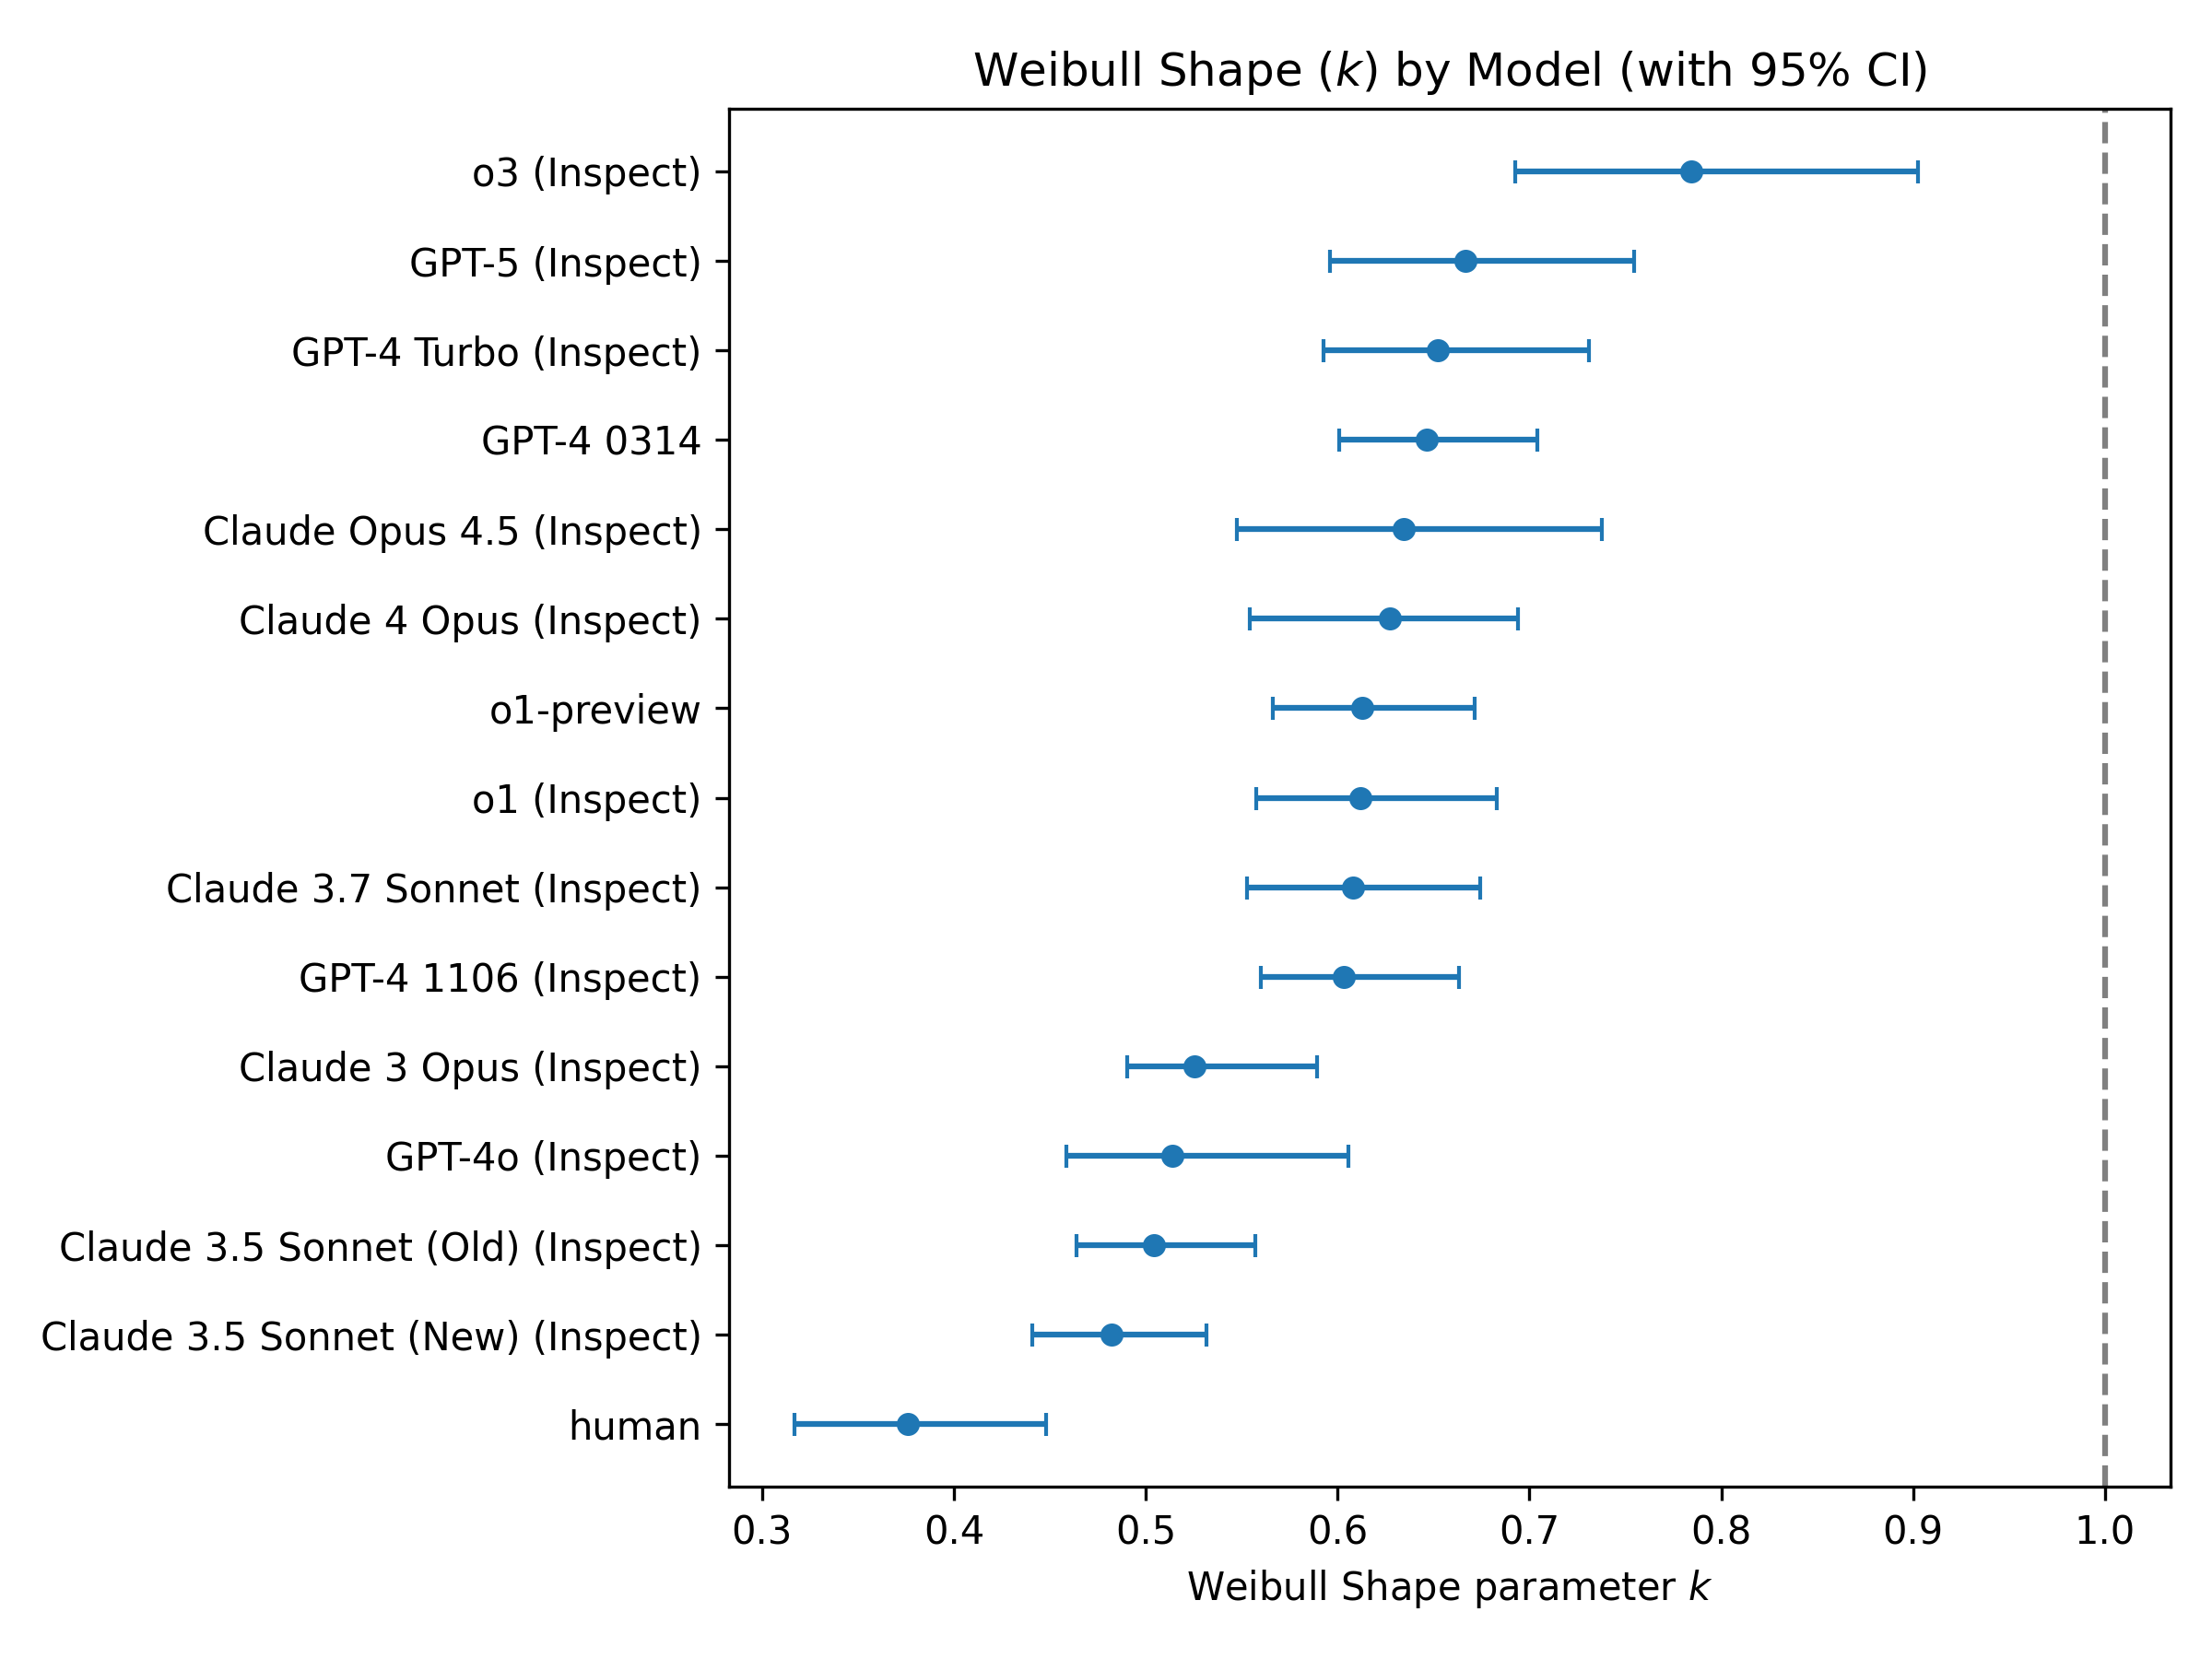
Second, there is a distinct gap between human and artificial reliability. When fitted to the same data, humans exhibit a Weibull shape parameter of approximately $\kappa=0.37$, while SOTA models cluster between $0.6$ and $0.9$. This suggests that humans possess a much more rapidly decreasing hazard rate; if a human understands a task well enough to survive the first few minutes, they rarely fail later. AI models, by contrast, maintain a higher background rate of random failure throughout the task. While scaling has improved their speed (median time), it has not yet fundamentally altered their reliability architecture to drop this error rate.
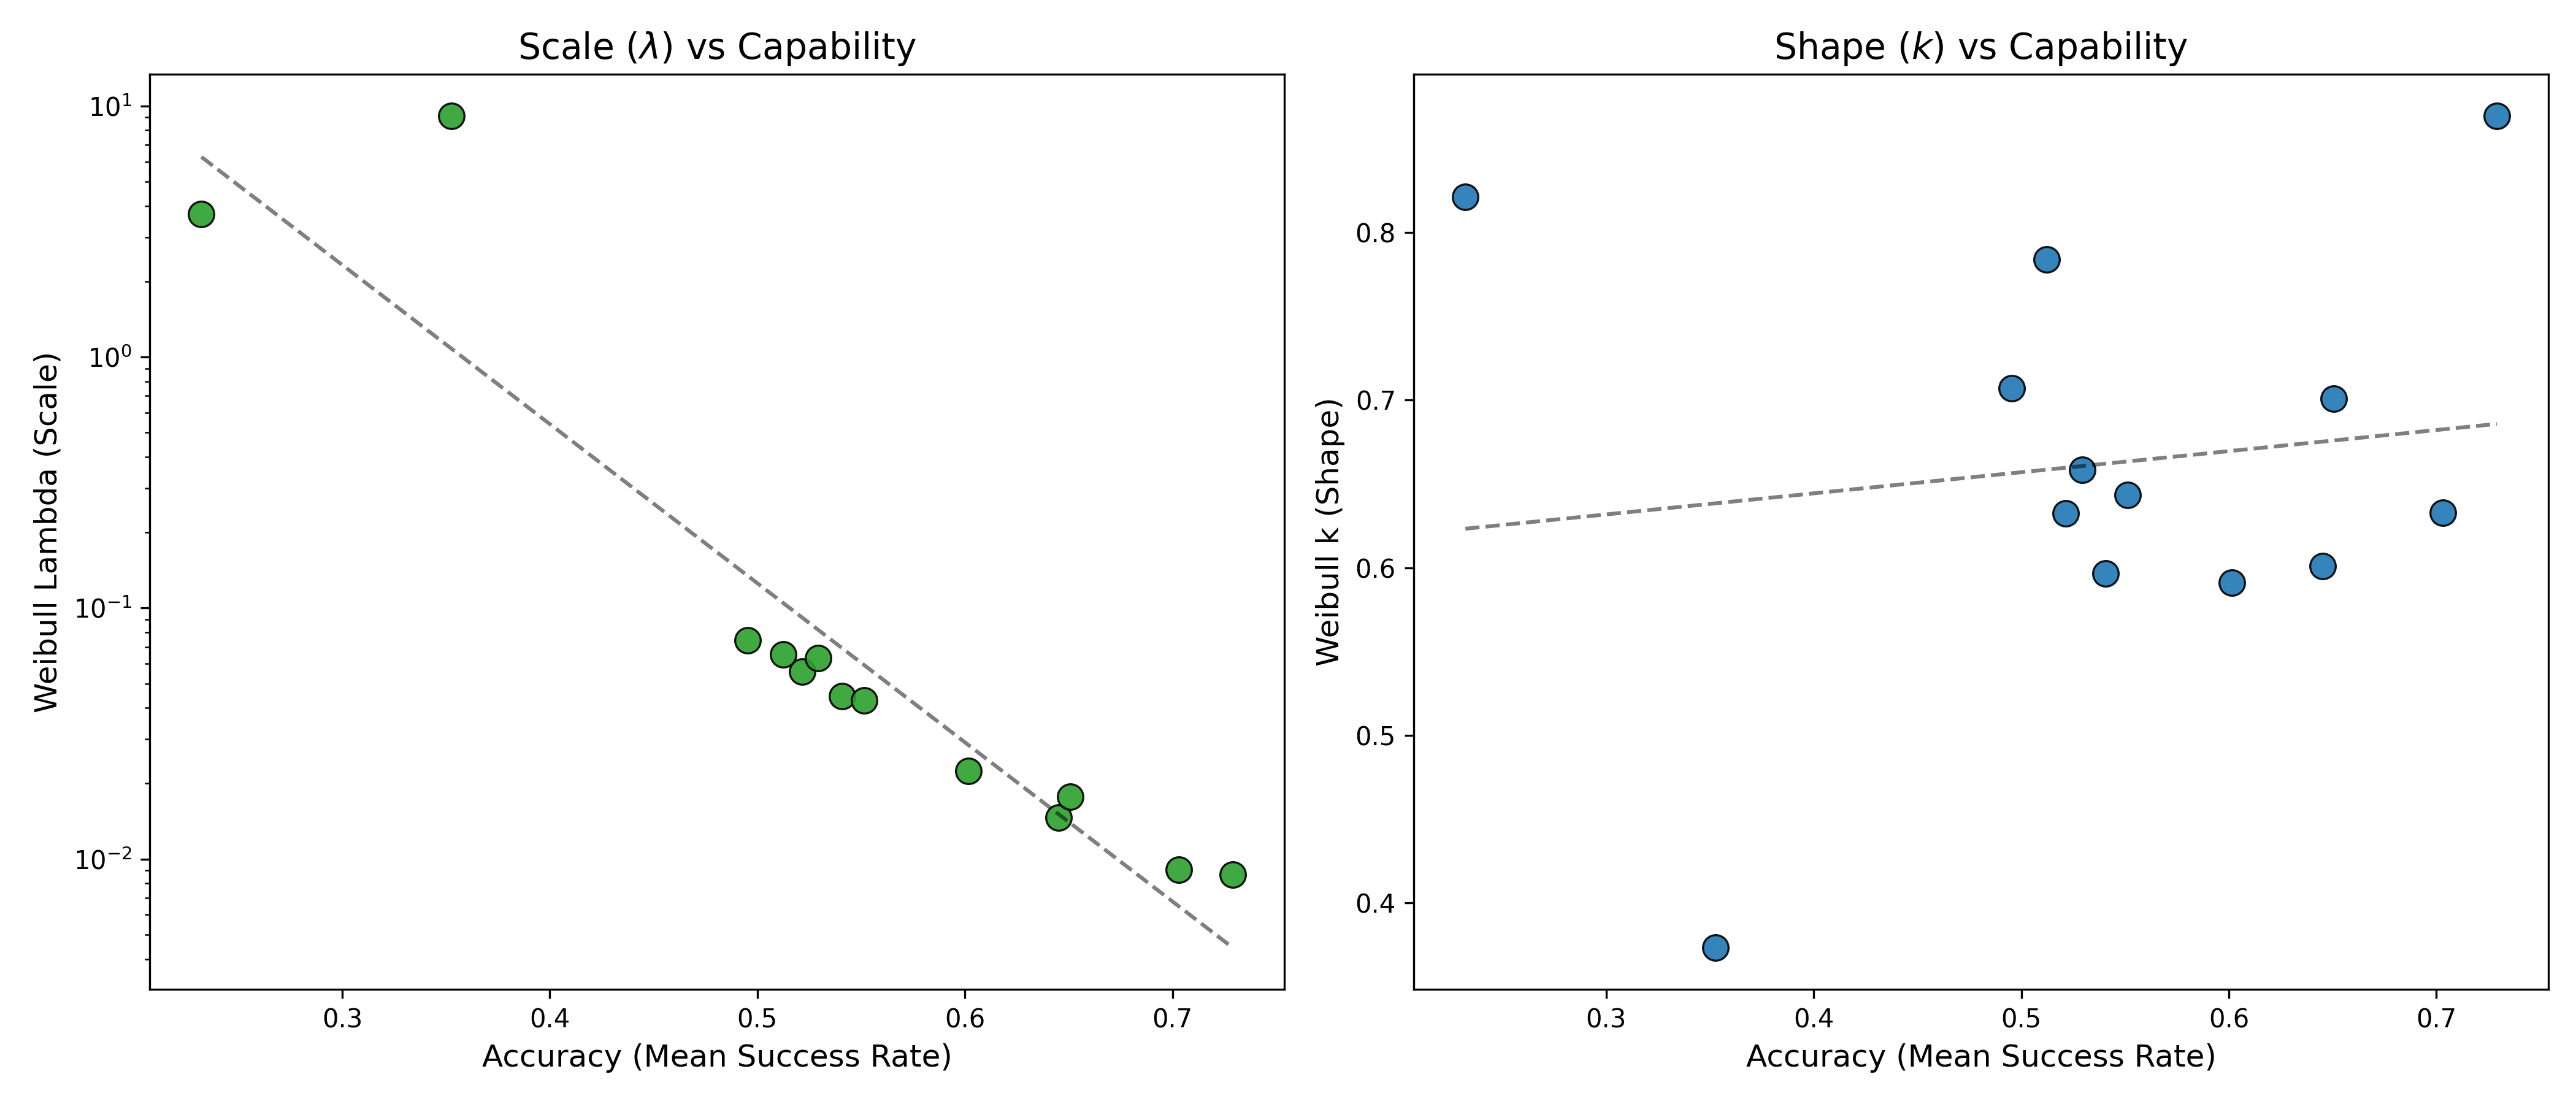
In fact, there is no correlation between model size and $\kappa$ at all, although lambda clearly decreases with larger, more powerful models. So basically, larger models exhibit lower error rates, but they don’t seem to intrinsically get better over time, like humans do.
Figure 2: Lambda: i.e. hazard rate for each model. Humans are the best (lowest hazard), but the frontier models have orders of magnitude lower hazard than the older models.
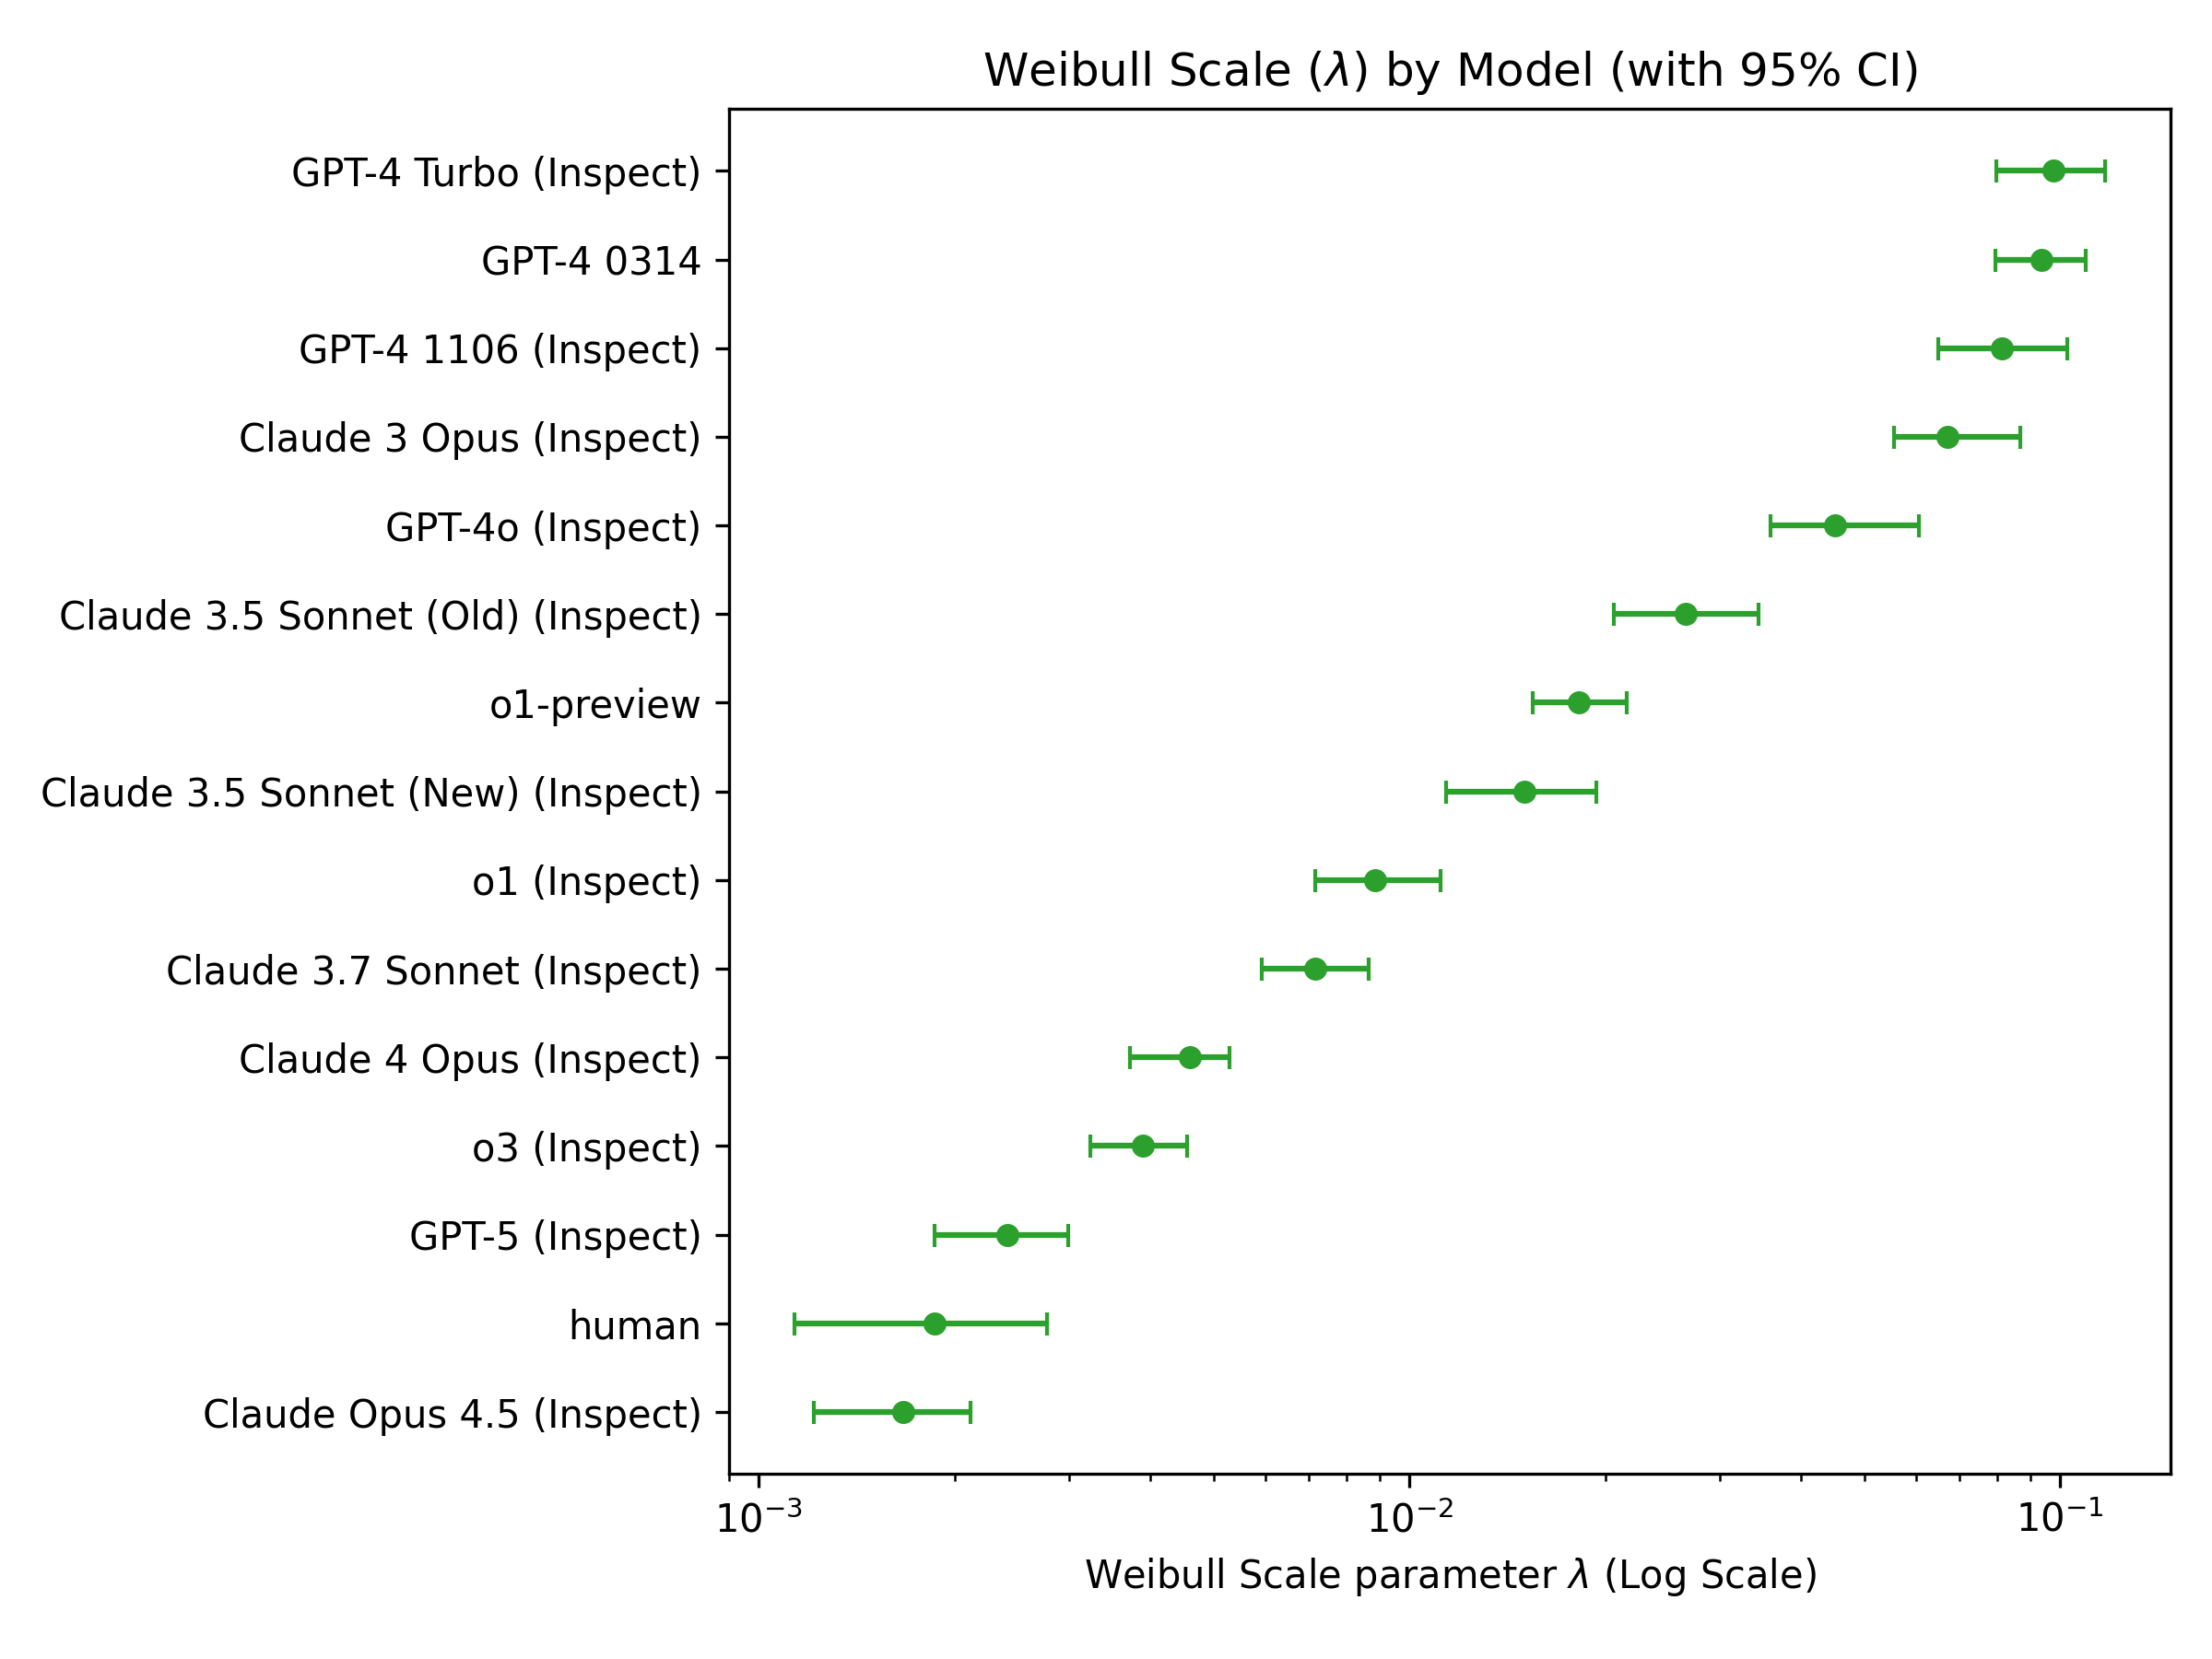
Figure 3: Although overall hazard drops with accuracy of the model, $\kappa$ doesn’t appear to correlate strongly. This is a bit weird!
It’s important to recognise that we are estimating two correlated parameters here, with limited data. The potential for overfitting is high. I did a number of things to avoid this, but I think we have to acknowledge that these estimates are based on limited data, particularly for earlier models that just fail right at the start. This is a bit weird, and I don’t want to overplay it, but it sort of suggests that the ability to reduce hazard over time is not an intrinsic property of model size or scaling, and might not naturally increase like the reduction in error rate.
Which is the right model?
Although it’s nice to produce these plots; the obvious question is whether the Weibull model is a better fit to the data than the logistic model from METR. The short answer is it fits about the same. In 7 LLMs, Weibull was favoured, in 7, logistic was favoured. The BIC in the Bayesian hierarchical model slightly favoured logistic, but really, the models, assessed on the available data, are pretty similar.
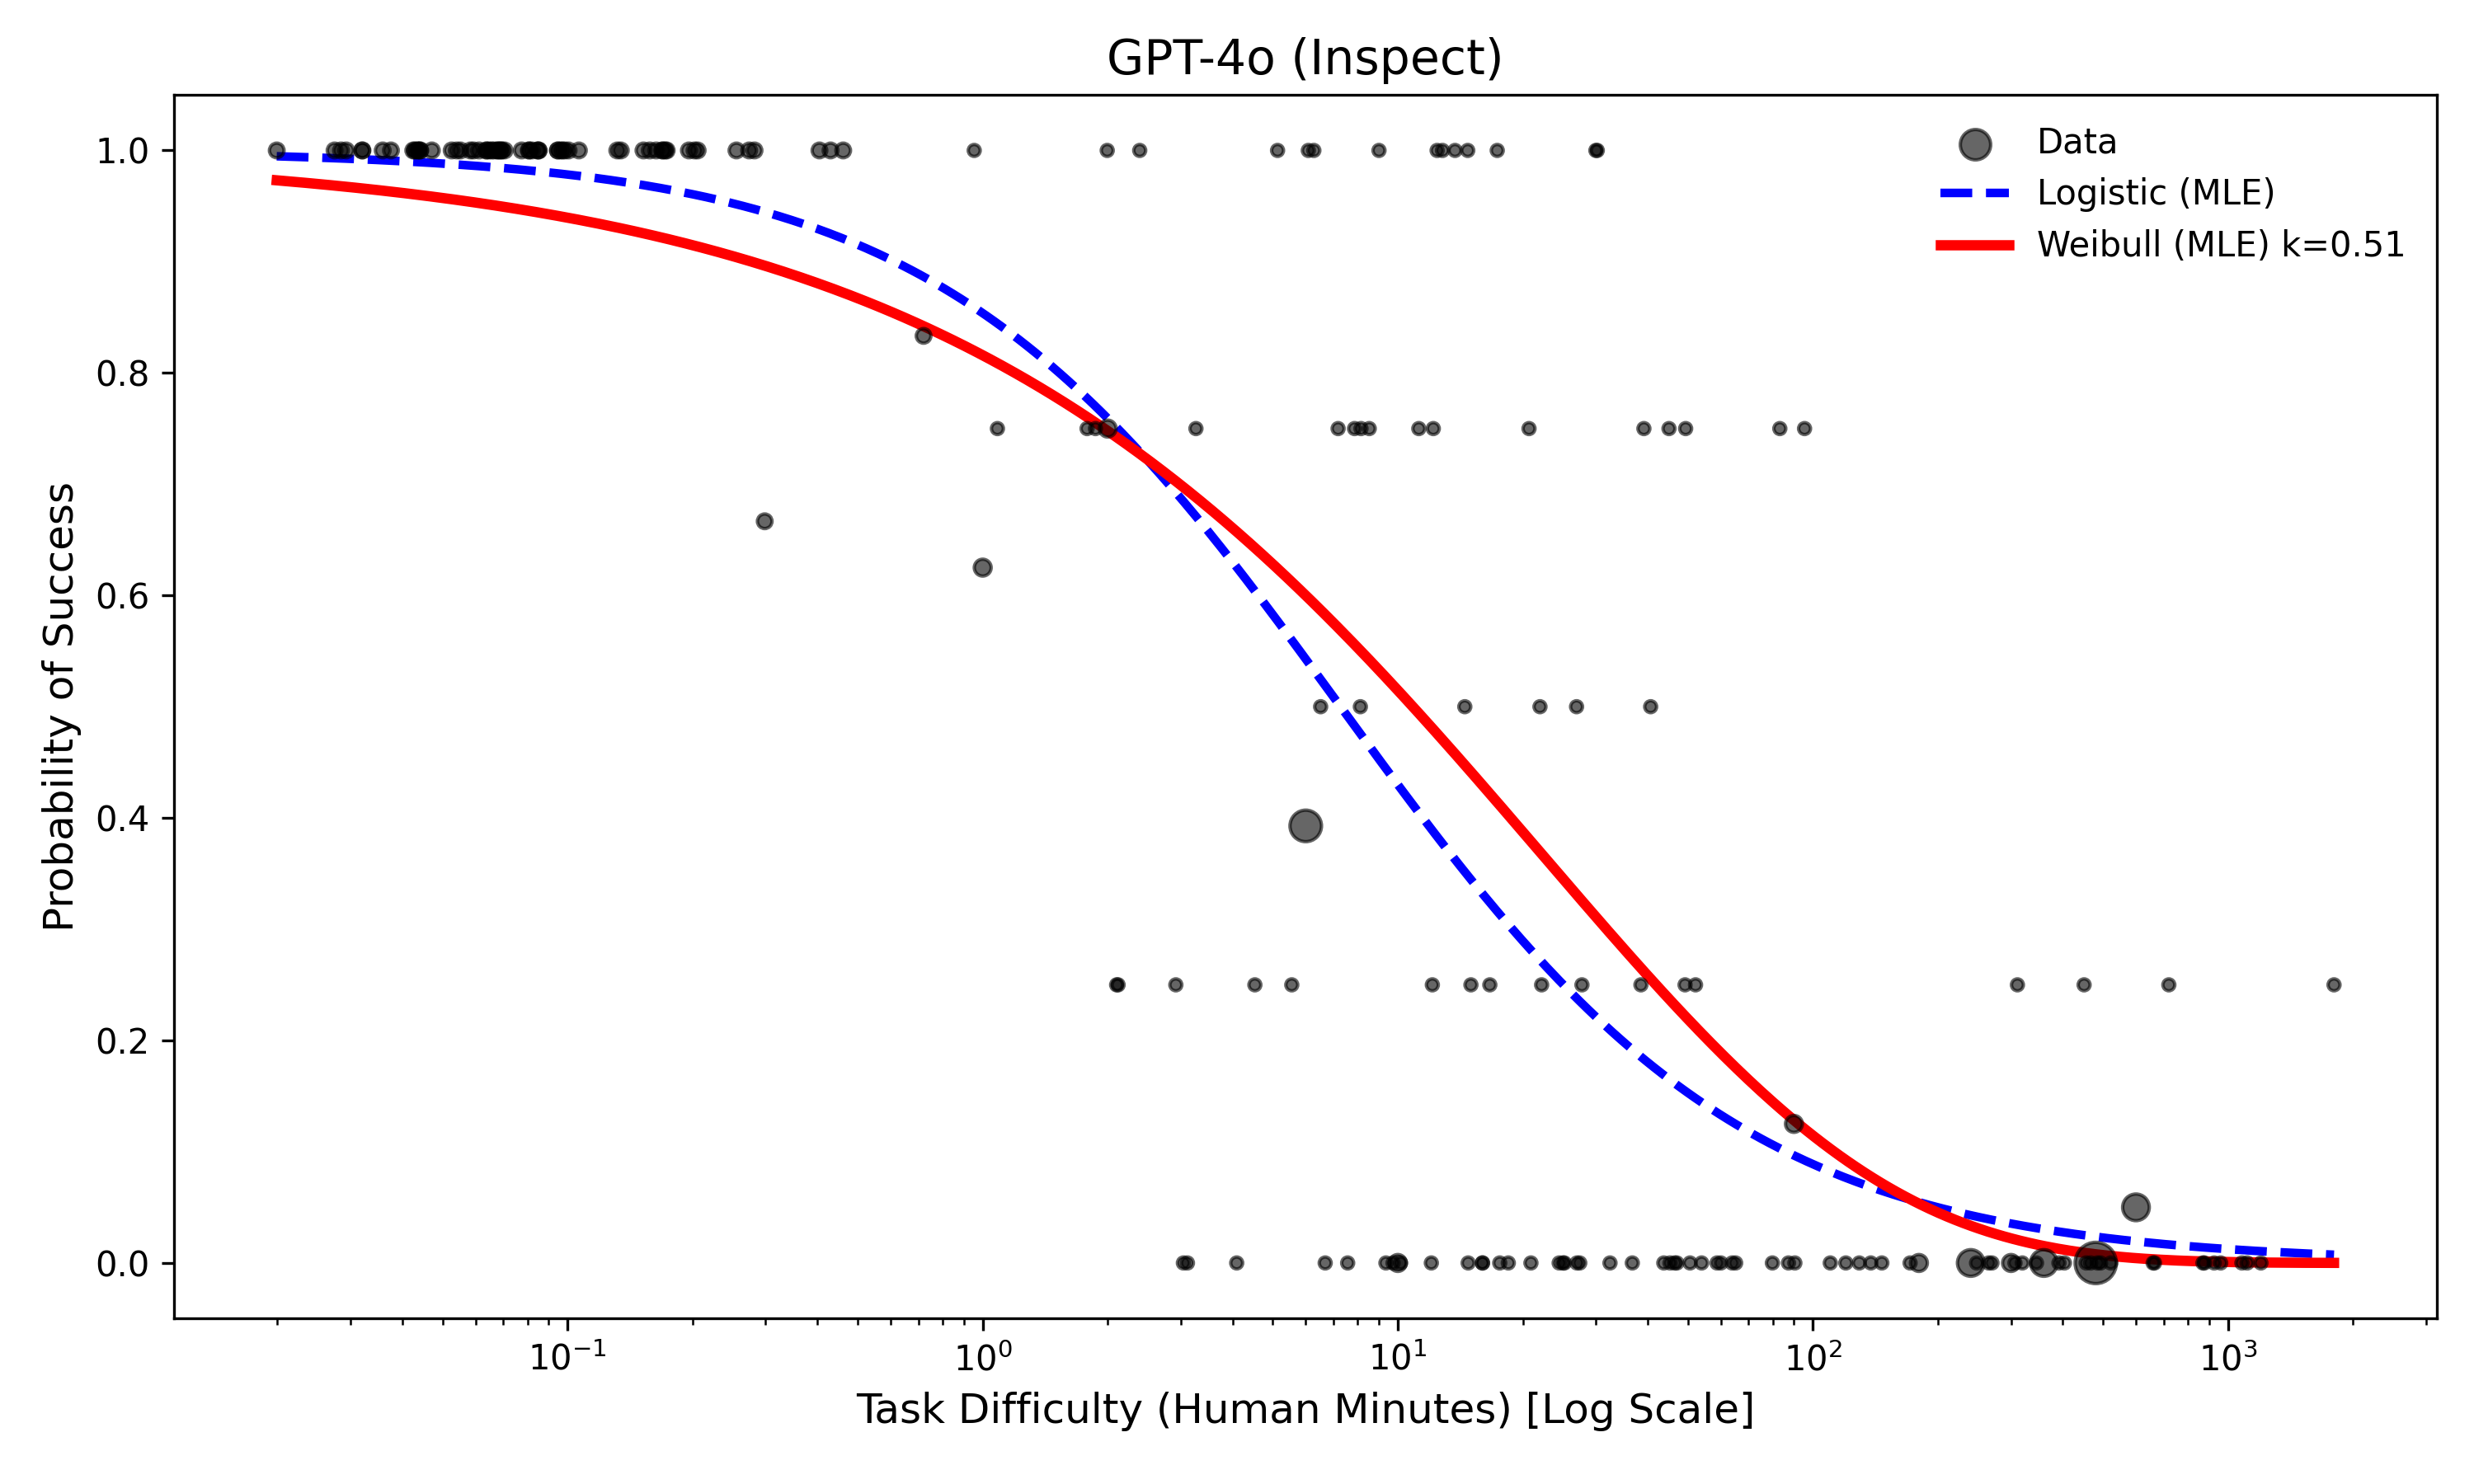
This occurs because the model fits in the middle of the data with these approaches are nearly identical. They fit the median performance almost perfectly, and accurately estimating at the tails requires lots of data. You can just about see this at the end of this plot of GPT-4o here, where the relative difference between the Logistic and Weibull model in success at 103 minutes is actually extreme on a relative scale.
Figure 4: Model fit for GPT4o. Red represents the Weibull plot, blue represents the logistic plot. Each dot is a task.
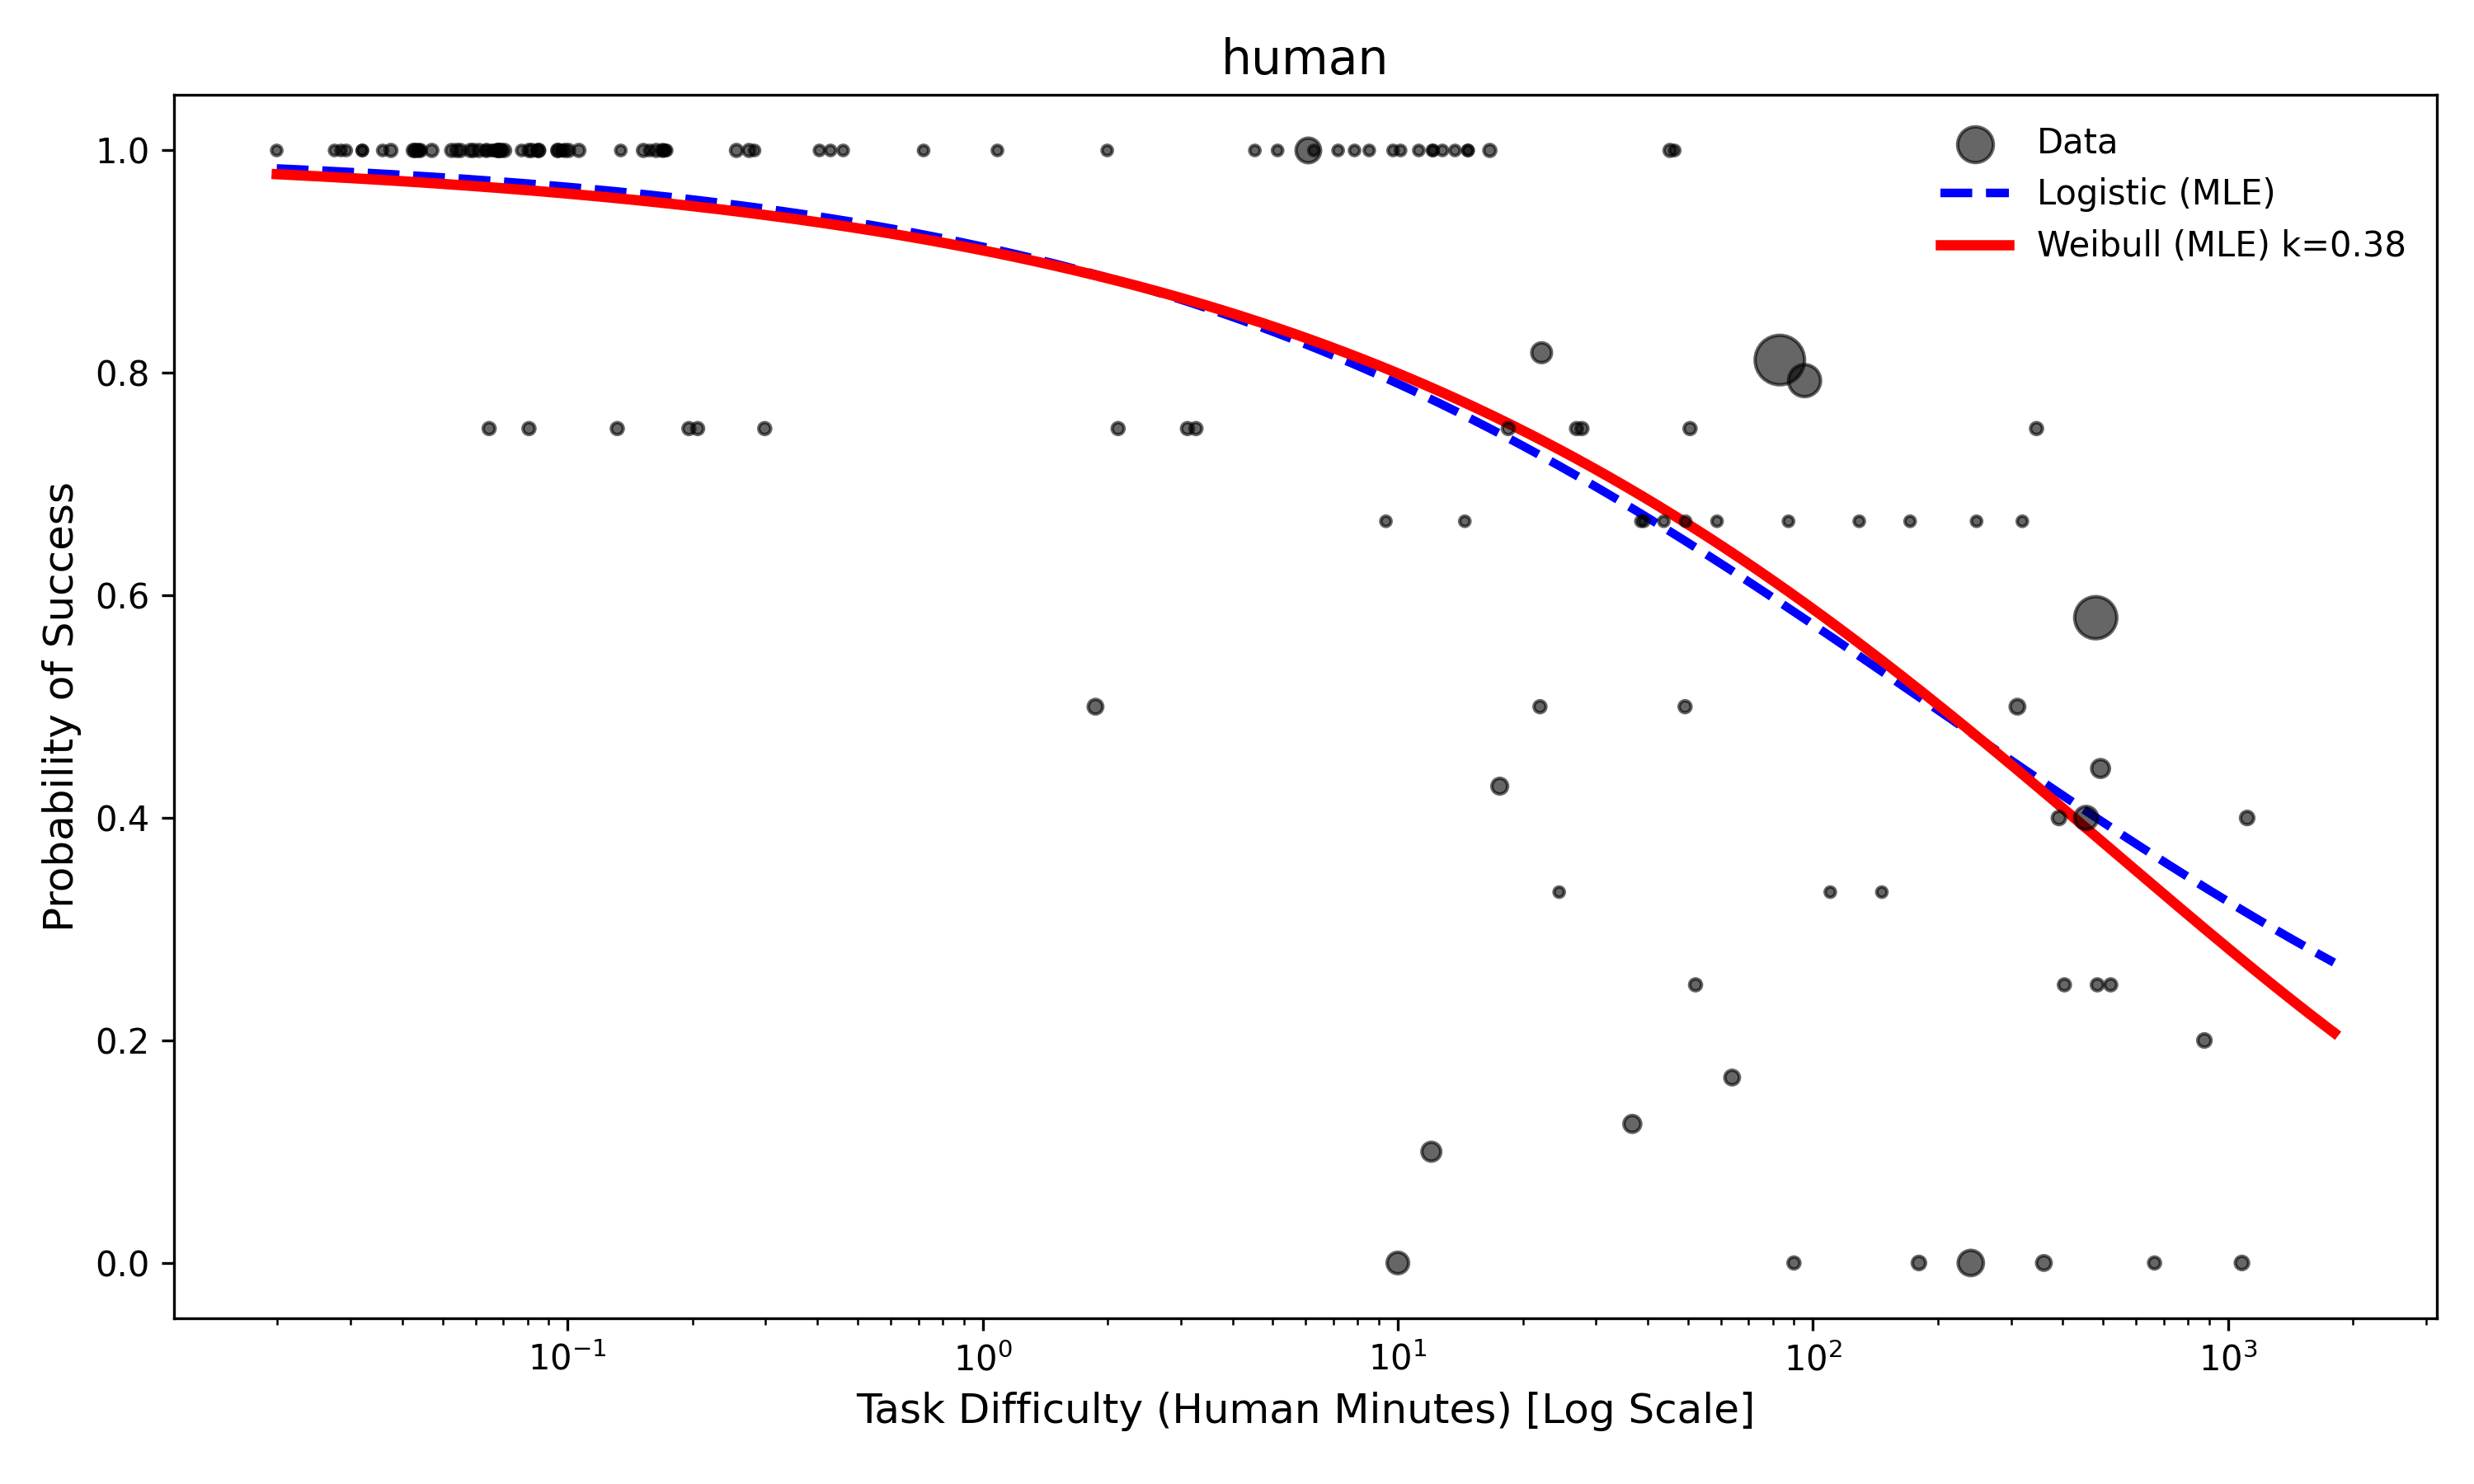
It’s even more obvious for humans that the tail diverges:
Figure 5: Model fit for Humans (assuming caption similarity to Fig 4 but for Humans). Red represents the Weibull plot, blue represents the logistic plot. Each dot is a task.
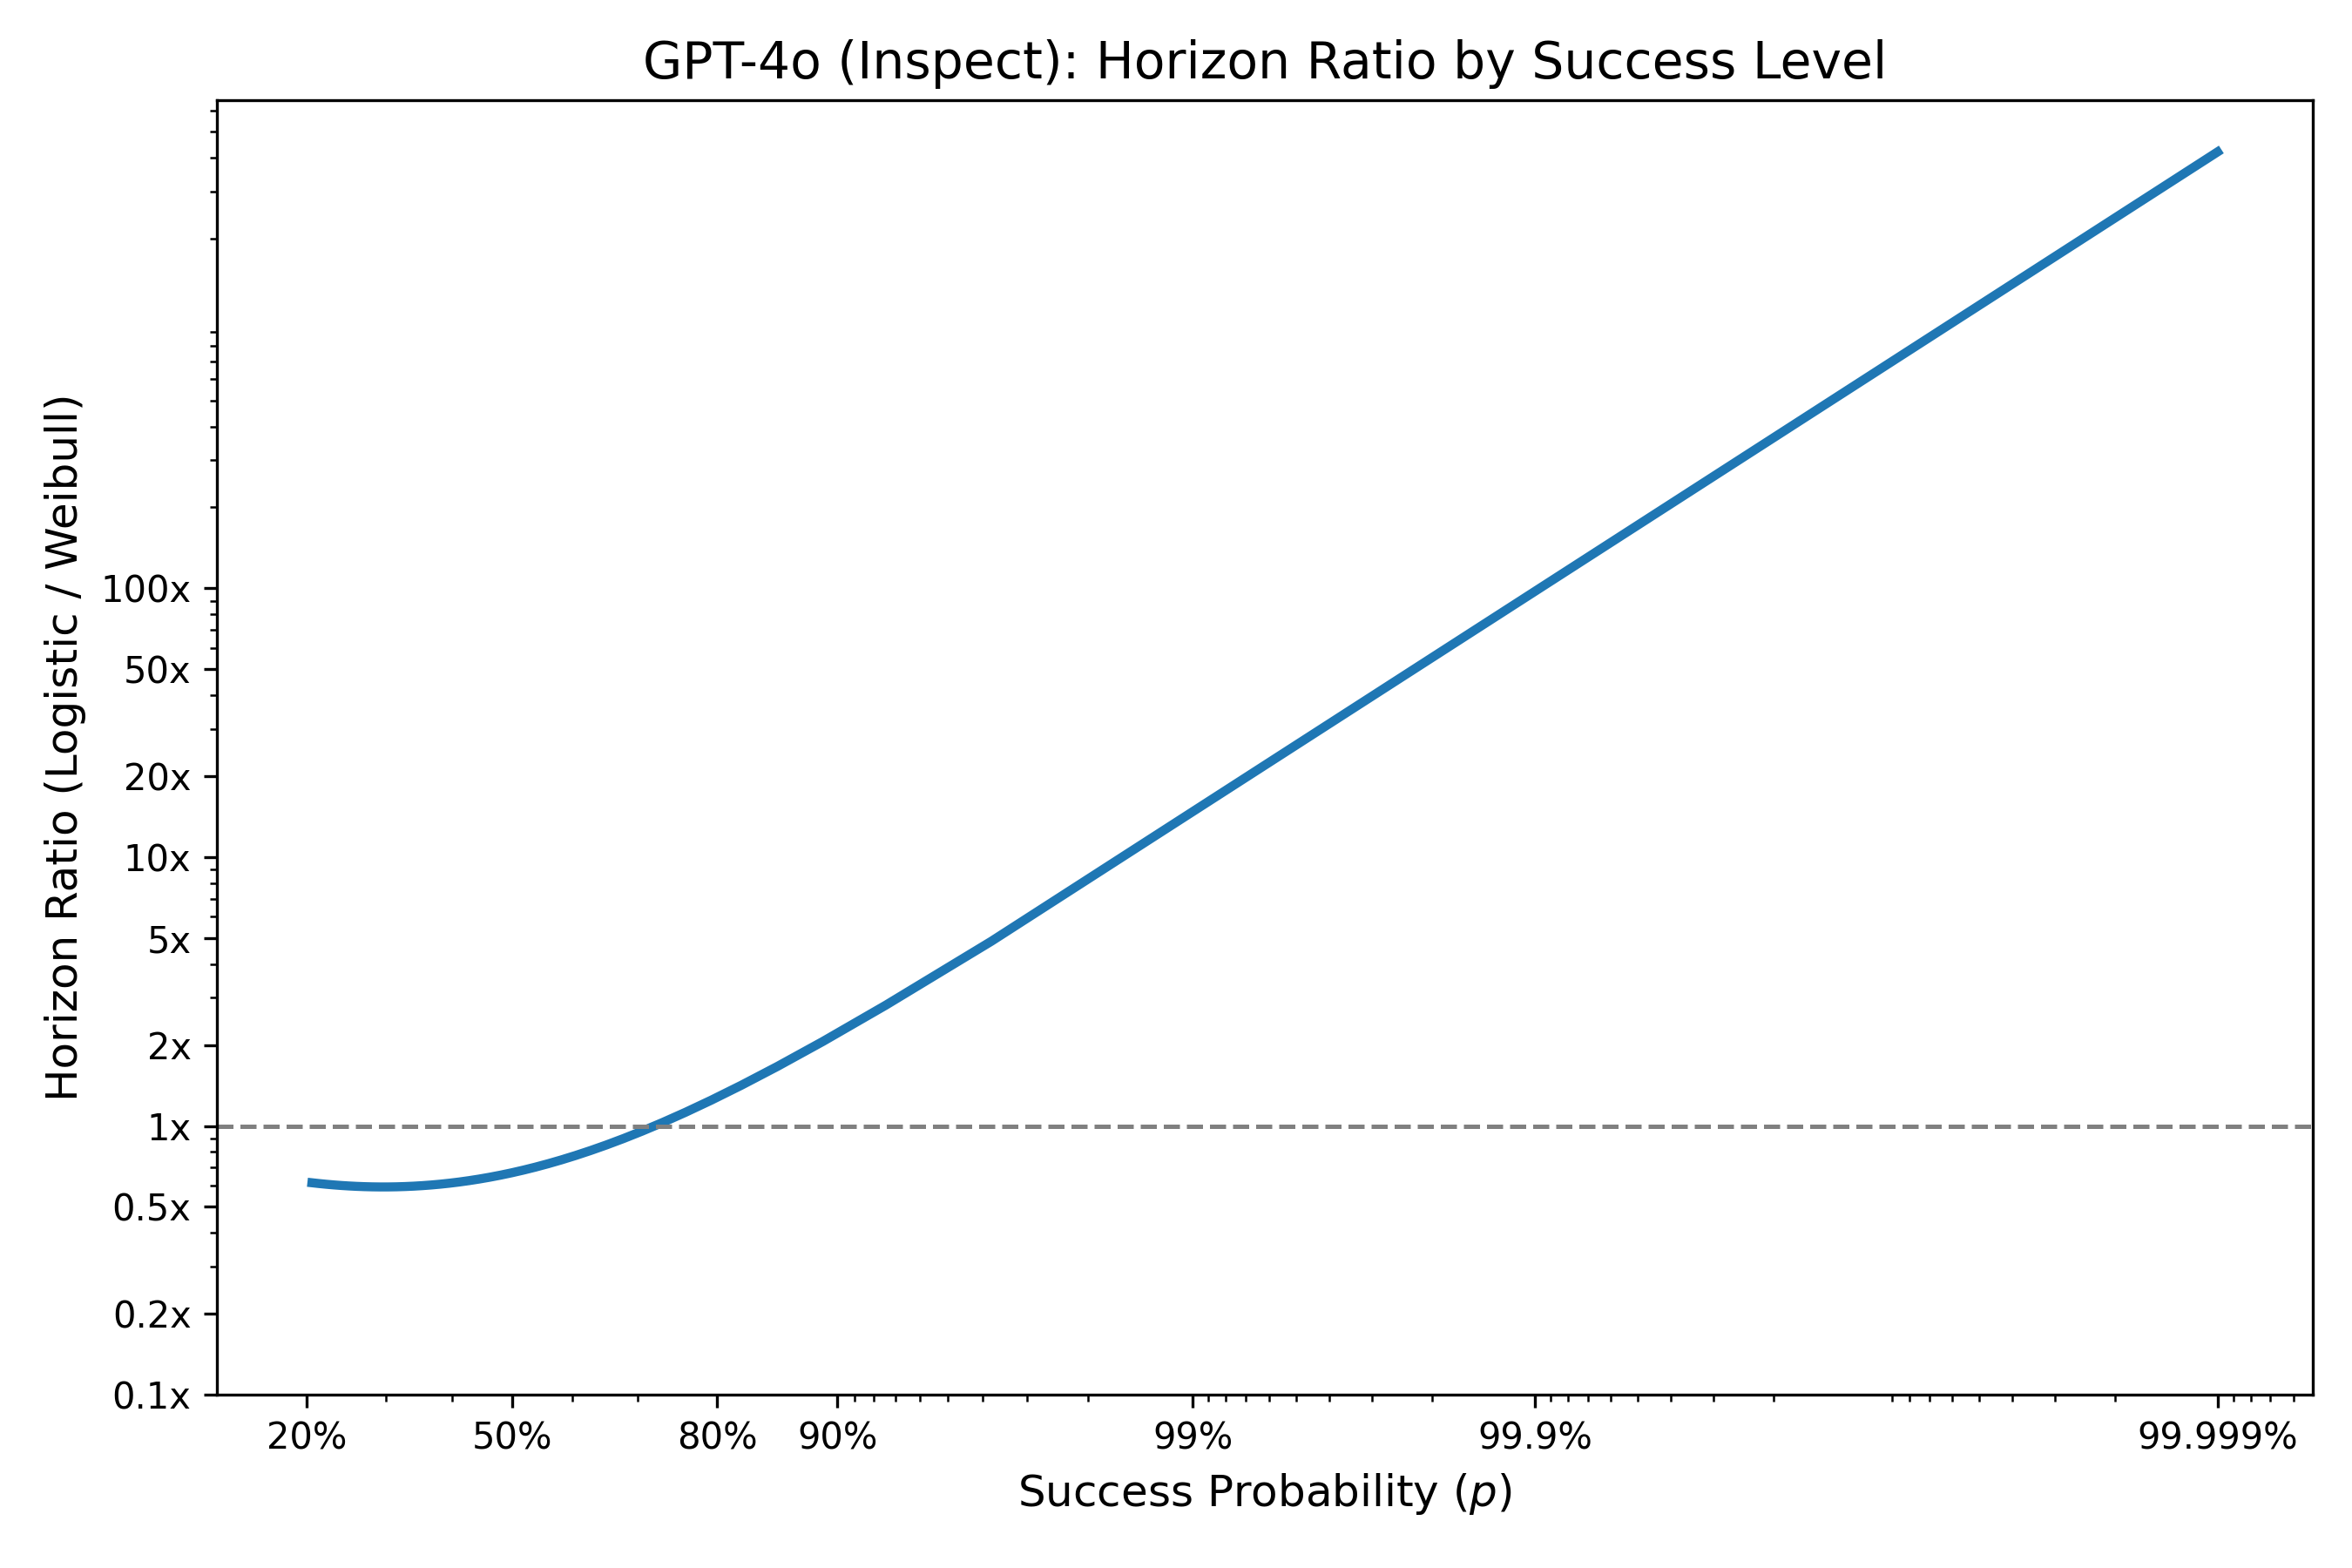
One way to understand this is if we calculate the horizon ratio, which represents the estimated horizon time for the logistic model at a given probability of success, this is basically equal between the models at moderate p’s (20%-80%), but becomes extreme at the tails: at 99.9% success, the Weibull model’s time horizon is 10x shorter than the logistic, while at 99.9% it’s 100x shorter.
Figure 6: Horizon ratio (e.g. multiplicative difference between Weibull and logistic models in the length of time an agent can run at a given % success).
This clearly has quite important implications for the future of AI agents if the Weibull model is true: there is a much much longer tail of failure, and a much greater capacity of models required to reduce hazard over time to achieve success at extremely easy tasks.One way to solve this would also be to collect lots of data on easy tasks that we should expect almost universal success. There are two issues, firstly, tasks are qualitatively different between short and long, which means the short tail might not reflect the long tail. Secondly, we still need to do it a lot to get power! If failure rates are say 0.01% with the Weibull model, and 0.01% with the logistic model, to detect a difference, we would need >10-20,000 tasks (ideally somewhat independent of each other [depending on your exact hypothesis]).
Perhaps the important point is that we simply do not have enough long-duration data to distinguish between these futures. As both models have such similar predictions at median success, we just have no idea (from the data) which one is more plausible.I am not suggesting one model here is true and that the other is not, clearly both models are simplifications of the process; and it is likely that the real model is more complex. But it’s clear that these have very different extreme fits and this has important implications.
So what does this mean?
Well, firstly, it means that we don’t have enough data to know what the true model of task failure, and given we are less able to have priors on why agents fail like we have in biological data, we should be agnostic about predictions around longer times. It seems to me that the Weibull fit is a more natural explanation of agentic failure than a simple logistic one, although the data fits logistic marginally better. To really test these, we need to have data over a much longer period of time / task difficulty, where the models will diverge.
Secondly, if the reported estimates I present are real, the real path to agentic success will not necessarily be in reducing the constant hazard (that seems easy enough, bigger models!), but in training models to reduce their hazard over time, like humans. The human $\kappa$ is still quite substantially smaller than the models tested by METR at that time, and there was little apparent association between model size and $\kappa$.We should be cautious here. Limited data on smaller models that failed a lot means model fits are a bit dodgy. I don’t think we can overinterpret this.
Finally, and this is a point well made by others, but highlighted by this data: we should be sceptical of any model that makes the assumption that the median is like the tails. This is not true in many fields and is actually a very strong assumption. The Weibull fits I present show vastly different estimates for tasks that are extremely long/difficult. I am not suggesting these are right, but I am pretty confident in this case that the tails are likely to be quite different, and that modelling this differently will give quite different answers.
PS: None of this is to criticise METR. I think if I were in their shoes, I would have performed and reported the same analysis as them. And they collated and released all the data for free, allowing me to do this re-analysis. It’s just different worldviews!